• Welcome to Smashboards, the world's largest Super Smash Brothers community! Over 250,000 Smash Bros. fans from around the world have come to discuss these great games in over 19 million posts!

    You are currently viewing our boards as a visitor. Click here to sign up right now and start on your path in the Smash community!

Need Math Help?

Corpsecreate

Smash Lord
Joined
Aug 24, 2008
Messages
1,208
Location
Australia, Perth
I'm not sure if this is correct but...

r^2 = cos(theta)

We know:
r^2 = x^2 + y^2
rcos(theta) = x ----> cos(theta) = x/r
rsin(theta) = y

so...r^2 = cos(theta) becomes (x^2+y^2) = x/r.
since r^2 = (x^2 + y^2) then r must be sqrt(x^2 + y^2) and so you have:

(x^2+y^2) = x/sqrt(x^2+y^2) or another way of writing it.
(x^2+y^2)^1.5 = x
 

Sasha

Smash Journeyman
Joined
Oct 24, 2007
Messages
323
Location
Berkerey, CA
Simplify:
(9+j)^(9+j).
Uh.

(9+j)^(9+j)
=(9+j)^9 * (9+j)^j

You could expand them out from there I guess, but that doesn't sound anything like simplifying.

What do you mean by "simplify" exactly?

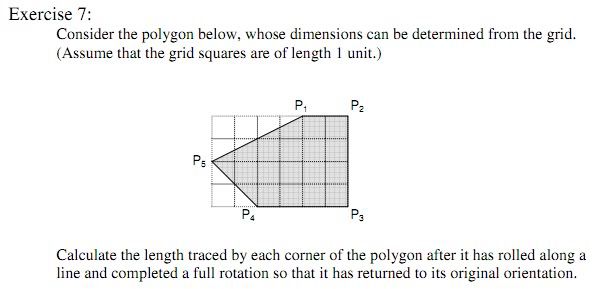
@Corpsecreate: I could tackle that problem by tracking each corner and using some geometric perimeter rules for circles and ellipses, but I'm not sure that's what you're looking for. Is there some algorithm for solving that kind of problem that you were taught or that you're looking for?
 

Dark Ryu

Smash Ace
Joined
Apr 20, 2007
Messages
976
Location
In Gojira's shirt (aka) Utah
Place the whole numbers 1 through 10 in the blanks below, using each number exactly once in such a way that each number is the absolute value of the difference of the two numbers directly above.

Once you find the correct arrangement of numbers, comment on the following questions:
1. What was your most successful strategy?
2. Are there any positions that cannot be filled with specific numbers?
3. Is your solution the only one possible? Why, or why not?


Help is appreciated. Thanks (:
 

terr13

Smash Journeyman
Joined
Sep 13, 2006
Messages
268
The answer I got was
Top Row: 8 3 10 9

I don't remember exactly everything I did, but I know I tried to write out an equation, or to turn the problem into other similar, but slightly easier problems without much success. In the end, I kind of brute forced it. I started by creating constraints on the solution, ie. 10 must be on the top. 8,9,10 must be in the top 2 rows. Then I just slowly eliminated possibilities going from bottom up. It wasn't that bad once you create constraints and then come up with fast ways to eliminate possibilities, ie if two numbers in the 2nd row from the top add up to 10, then the solution automatically fails, and you can quickly isolate the lonely number on the bottom to only a few possibilities.

I'm not sure what you mean. If you mean position as in position on the graph, then there are constraints, such as 10 being on the top row. In fact, the way I solved it was pretty much creating constraints and then testing the remaining variables.

Besides the reflection of this solution, I don't think any other exist, but I'm not too confident about this.
 

M.K

Level 55
Joined
Jul 10, 2007
Messages
6,033
Location
North Carolina
Anyone that has had a Statistics class, could you help me with this problem?

Does delaying oral practice hinder learning a foreign language? Researchers randomly assigned 23 beginning students of Spanish to begin speaking practice immediately and another 23 to delay speaking for 4 weeks. At the end of the semester both groups took a standard test of comprehension of spoken Spanish. Suppose that in the population of all beginning students, the test scores for early speaking vary according to the N(32,6) distribution and scores for delayed speaking have the N(29,5) distribution.

1. What is the sampling distribution of the mean score x(bar) in the early-speaking group in many repetitions of the experiment? What is the sampling distribution of mean score y(bar) in the delayed speaking group?

2. If the experiment were repeated many times, what would be the sampling distribution of the difference y(bar)-x(bar) between the mean scores in the two groups?

3. What is the probability that the experiment will find (misleadingly) that the mean score for delayed speaking is at least as large as that for the early-speaking group?
 

Staz

Smash Lord
Joined
Oct 6, 2007
Messages
1,070
Location
Springville, Utah
I can help you out Meta-Kirby. I'm running out of my house right now but I'll edit this post with the answer tomorrow unless someone else already does.
You think you can help me out with some math homework? I mean I suck bad at it. like it's not even in funny and you being in utah and all means we could get together sometime and have a study date ;)
 

ballin4life

Smash Hero
Joined
Nov 12, 2008
Messages
5,534
Location
disproving determinism
Anyone that has had a Statistics class, could you help me with this problem?
Does delaying oral practice hinder learning a foreign language? Researchers randomly assigned 23 beginning students of Spanish to begin speaking practice immediately and another 23 to delay speaking for 4 weeks. At the end of the semester both groups took a standard test of comprehension of spoken Spanish. Suppose that in the population of all beginning students, the test scores for early speaking vary according to the N(32,6) distribution and scores for delayed speaking have the N(29,5) distribution.

1. What is the sampling distribution of the mean score x(bar) in the early-speaking group in many repetitions of the experiment? What is the sampling distribution of mean score y(bar) in the delayed speaking group?

2. If the experiment were repeated many times, what would be the sampling distribution of the difference y(bar)-x(bar) between the mean scores in the two groups?

3. What is the probability that the experiment will find (misleadingly) that the mean score for delayed speaking is at least as large as that for the early-speaking group?
1. The sampling distribution will be N( 32, 6/sqrt(23) ) for the early speakers and N( 29, 5/sqrt(23) ) - assuming the second number is the standard deviation (rather than the variance)
Check: http://en.wikipedia.org/wiki/Sampling_distribution - basically for sampling distribution you divide the standard deviation by sqrt(n) - this is called standard error. Note that sample mean becomes normally distributed for ANY starting distribution if n is big enough (this is called the Central Limit Theorem).

2. That wiki link has the answer. Anyway, the difference between two normal distributions is normal, so the difference between early and late populations is N( 3, sqrt(6^2 + 5^2) ). Then, when you factor in that n=23 the sampling distribution will be N( 3, sqrt(61)/sqrt(23) )

3. In part 2 we found the distribution. So we just have to see how often that distribution gives us a negative number (where Early - Delayed is negative, that means Delayed > Early). You should be able to plug that in your calculator.
This is called a Type 2 error, where we falsely accept the null hypothesis (the null hypothesis in this case being that there is no difference between the two groups).


I think these answers are right unless I misunderstood the questions.
 

1048576

Smash Master
Joined
Oct 1, 2006
Messages
3,417
Place the whole numbers 1 through 10 in the blanks below, using each number exactly once in such a way that each number is the absolute value of the difference of the two numbers directly above.

Once you find the correct arrangement of numbers, comment on the following questions:
1. What was your most successful strategy?
2. Are there any positions that cannot be filled with specific numbers?
3. Is your solution the only one possible? Why, or why not?


Help is appreciated. Thanks (:
1. I wrote a program in Java and just brute forced it. Everything else is determined after the top row is filled in, so I just plugged in all 10000 possible combinations with each number 1-10 in the first row, found all the other numbers, and checked if the result fit all the criteria (unique to all other elements, > 0, < 11)

2. Yes, see solutions

3. Here are all the solutions:

[6, 1, 10, 8, 5, 9, 2, 4, 7, 3]
[6, 10, 1, 8, 4, 9, 7, 5, 2, 3]
[8, 1, 10, 6, 7, 9, 4, 2, 5, 3]
[8, 3, 10, 9, 5, 7, 1, 2, 6, 4]
[8, 10, 1, 6, 2, 9, 5, 7, 4, 3]
[8, 10, 3, 9, 2, 7, 6, 5, 1, 4]
[9, 3, 10, 8, 6, 7, 2, 1, 5, 4]
[9, 10, 3, 8, 1, 7, 5, 6, 2, 4]

starting at the top left and moving right, then down.
 

Grandeza

Smash Master
Joined
Nov 11, 2007
Messages
4,035
Location
Brooklyn,New York
Hey I was absent from my math class the past few days. We're doing trig and we just started graphing the functions. I understand how to graph y=sin(x) and all the other forms of that. I also know y=cos(x) and all the amplitude, period and other alterations. I was absent for the graph of y=tan(x), and all the graphs of the inverse functions. So if anyone could explain how to go about graphing them and how to find the period and amplitude. Thanks
 

TuxingtonIII

Smash Apprentice
Joined
Feb 19, 2011
Messages
121
Location
Urbana, IL
Hey I was absent from my math class the past few days. We're doing trig and we just started graphing the functions. I understand how to graph y=sin(x) and all the other forms of that. I also know y=cos(x) and all the amplitude, period and other alterations. I was absent for the graph of y=tan(x), and all the graphs of the inverse functions. So if anyone could explain how to go about graphing them and how to find the period and amplitude. Thanks

I can't remember if the "other" graphs that I describe are { arcsine, arccosine, arctangent } or { cosecant, secant, cotangent }, quick internet searches seem to say they are {cosecant, secant, cotangent } but make sure you can put them in your calc to confirm, and just remember my "mental notes" on how to draw them :)

For cosecant (1/sin) & secant (1/cosine), draw the original sin/cosine, and then draw humps going from +/- infinity (+ infinity if the sine peak is +1, -infinity if the sine peak is -1) to the 1.0 of the normal sin/cosine to "make the graphs kiss" and then go back up to +/- infinity. Alternate to -/+

The [full] period is the same: 2*pi


For tan(x), I actually start with the other one (cotangent):

It's always "cotangent is going down". At 0, it's positive infinity, then by the end of its period (1*pi, unlike sine), it is at -infinity, but reaching 0 at pi/2. The discontinuity then jumps from -infinity to +infinity (this is at 1*pi, the period)


For REGULAR tangent, it starts at (0,0) and goes in the opposite direction (up) -- the period is the same (1*pi) BUT it starts at (0,0), so the discontinuity is at pi/2 rather than 1*pi like cotangent

So:
sine: start at 0,0 and wave
cosecant: make it kiss sine

cosine: start at 0,1 and wave
secant: make it kiss cosine

tangent: start at 0,0 and go up
cotangent: start at 0,+infinity and go down


Sorry if I said anything wrong, it's been a while :/
 

ballin4life

Smash Hero
Joined
Nov 12, 2008
Messages
5,534
Location
disproving determinism
Look up the graphs on Wikipedia. It should then be obvious how to shift for amplitude/period/etc (it's exactly the same as with sin and cos).

Or just do the good old method of plotting a bunch of points and then connecting them.

Or get a graphing calculator.
 

M.K

Level 55
Joined
Jul 10, 2007
Messages
6,033
Location
North Carolina
Alright, here's a question for everyone:

At Dicey Dan’s Diner, the dinner buffet usually costs $11.99. Once a month,
Dan sponsors “lucky buffet” night. On that night, each customer can either
pay the usual price or roll two fair, six-sided dice and pay a number of dollars
equal to the product of the numbers showing on the two faces.

What is the distribution of X if X = the amount an individual customer pays for the buffett after rolling the dice?


So, usually the answers to these problem are either "binomial" or "geometric", but this question is neither because the probability of each trial is not the same (breaking one of the rules).
So, I'm confused as to what the question is asking. Does it just want me to find N(Mean, st. dev) for this??
THANK YOU SO MUCH :D
 
D

Deleted member

Guest
I think you just need to give the distribution with the probabilities on the vert. axis and each of the 36 outcomes on the horizontal axis
 

M.K

Level 55
Joined
Jul 10, 2007
Messages
6,033
Location
North Carolina
Alright, cool, that's what I did.

Now the last problem:

A group of 40 people gambles on the buffet.
What's the probability that the total amount paid by the group is more than $479.60?


I got the distribution of N for ONE customer as N(12.25, 8.94)

So the mean and st. dev of the 40-person sized SRS is (12.25, (8.94/sqrt(40))

(8.94 / sqrt(40)) = 1.414


So then it should be:

z = 11.99 - 12.25 / (1.414)

right?
 

Corpsecreate

Smash Lord
Joined
Aug 24, 2008
Messages
1,208
Location
Australia, Perth
When regressing a set of data, is the more 'accurate' regression the one with the lowest error or the one with the best correlation coefficient? I have a set of 50 data points and I can regress it in one of two ways.

1. ax^4 + bx^3 + cx^2 + dx + e
2. ax^b

The first form gives me r^2 as 0.99998885 and has total error 3963.4
The second form gives me r^2 as 0.99861121 and has total error 0.002

Which regression is better?
 

ballin4life

Smash Hero
Joined
Nov 12, 2008
Messages
5,534
Location
disproving determinism
I think it's the one with lower total error. Also I always thought that you only use the correlation coefficient with linear regressions. In fact, I'm not sure what you mean by a regression function having a correlation coefficient.

see the chart at the top of: http://en.wikipedia.org/wiki/Pearson_product-moment_correlation_coefficient

It shows how data sets with a clear nonlinear pattern can have correlation coefficient 0.
 

terr13

Smash Journeyman
Joined
Sep 13, 2006
Messages
268
I took it back in the day, like 4 or 5 years ago, go ahead and post the questions, that would be interesting.
 

Strife

Banned via Warnings
Joined
Mar 17, 2011
Messages
784
I feel like I've become really good at math lately. I'd be glad to help anyone who needs help.
 

terr13

Smash Journeyman
Joined
Sep 13, 2006
Messages
268
That's a very very weird thing to say, what made you decide to become really good at math?
 

MK26

Smash Master
Joined
Jun 29, 2008
Messages
4,450
Location
http://www.mediafire.com/?zj2oddmz0yy for ZSS fix!
Alright, one I keep second-guessing myself on is: The sum of the first 2011 terms of a geometric sequence is 200, and the sum of the first 4022 terms is 380. What is the sum of the first 6033 terms?

I answered 540, but keep thinking I should've put 542
I hadn't done anything with geometric sequences in over a year :'(
 

Corpsecreate

Smash Lord
Joined
Aug 24, 2008
Messages
1,208
Location
Australia, Perth
The way I did it was the first 2011 terms sums to 200, the next 2011 sums to 180 (380-200) and so the overall decay after 2011 terms is 0.9 which is 180/200. So it makes sense that the next 2011 terms will increase the total sum by 0.9*180 = 162

380+162 = 542

I'm having a little trouble with a question for operations research.

Max Z = 15x1 + 4x2
S.T 3x1 + x2 <= 30
2x1 + 2x2 <= 40
x1 + 2x2 >= 10
-2x1 +x2 <= 8
x1, x2 >= 0

Formulate the dual of this problem and use the principle of complementary slackness to find the optimal solution of the dual.

I get:

Min W = 30y1 + 40y2 - 10y3 + 8y4
S.T 3y1 + 2y2 -y3 -2y4 >= 15
y1 - 2y2 - 2y3 + y4 >= 4

y1, y2, y3, y4 >= 0

The coefficients of the final tableau of the primal is:
x1 x2 x3 x4 x5 x6
0 0 26/5 0 3/5 0

so y1 = 26/5
y2 = 0
y3 = 3/5
y4 = 0
y5 (slack) = 0
y6 (slack) = 0

Apparently this is wrong but I dont know why?
 

MK26

Smash Master
Joined
Jun 29, 2008
Messages
4,450
Location
http://www.mediafire.com/?zj2oddmz0yy for ZSS fix!
at corpsecreate, you'd assume so, right?

but heres a simpler question

first 2 numbers add to 4
first 4 numbers add to 40
what do the first 6 numbers add to?

the numbers are a =
1
and r =
3
, and the answer is
364
so im not 100% sure if 542 is correct

Dammit
Looking back at this it is almost certainly 542.
 

ballin4life

Smash Hero
Joined
Nov 12, 2008
Messages
5,534
Location
disproving determinism
unfortunately both a and r are unknown, and i'm looking at numbers up to r^6032...and at the number of decimal places that 'r' must have for ar^6032 to not be significantly different from 'a' makes solving the problem that way unfeasable
Huh? You can use the formula to set up equations:

a(1-r^(2011))/(1-r) = 200

a(1-r^(4022))/(1-r) = 380

Two variables, two equations. So you can solve for a and r, then use the formula again to find the 6033rd term.

(Divide the second equation by the first, then factor the remaining polynomial.)

That should give you the answer unless I severely messed something up.

r is the 2011th root of .9

This is pretty much exactly what Corpsecrate did
 

ballin4life

Smash Hero
Joined
Nov 12, 2008
Messages
5,534
Location
disproving determinism
at corpsecreate, you'd assume so, right?

but heres a simpler question

first 2 numbers add to 4
first 4 numbers add to 40
what do the first 6 numbers add to?

the numbers are a =
1
and r =
3
, and the answer is
364
so im not 100% sure if 542 is correct

Dammit
Looking back at this it is almost certainly 542.
This works fine with his method. First 2 add up to 4, next 2 add up to 36, so there is a multiplier of 9. The next 2 should add up to 36*9 = 324.

And they do.
 
Top Bottom